OPEN SOURCE MONITORING ENGINE

Nagios Core Features

Comprehensive network, server, and application monitoring with powerful capabilities. 

core

ENTERPRISE EDITION

Need Enterprise Features? Try Nagios XI

Get all the monitoring power of Core plus enterprise-grade UI and management tools.

Modern Web Dashboards
Configuration Wizards
Advanced Reporting
Capacity Planning
Professional Support
Enterprise Integrations

NAGIOS CORE FEATURES

Comprehensive Monitoring Capabilities

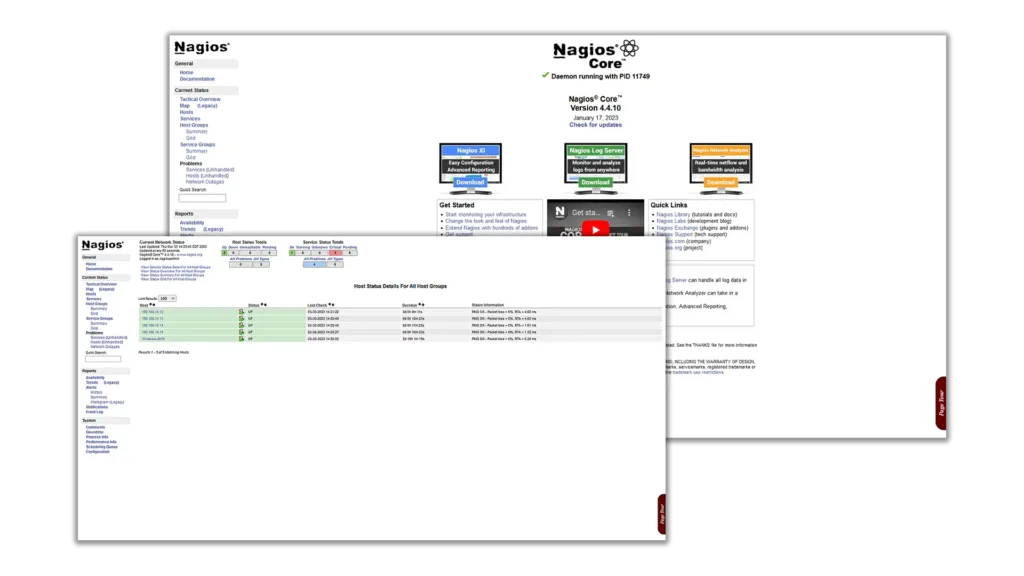
Experiment, learn, and monitor anything in your environment with an open-source tool built for curious builders and tech enthusiasts.

Network Monitoring

  • Network Services Monitor SMTP, POP3, HTTP, NNTP, ICMP, SNMP, FTP, SSH and more
  • Network Protocols Full protocol monitoring including TCP, UDP, ICMP ping
  • Bandwidth Monitoring Track network bandwidth usage and performance
  • Device Availability Monitor routers, switches, firewalls, and network devices
  • Network Host Hierarchy Define parent hosts to detect down vs unreachable hosts
  • SNMP Monitoring Comprehensive SNMP v1, v2c, and v3 support
  • Network Discovery Automatically discover network devices
Nagios excels at network monitoring with proven reliability detecting and distinguishing between hosts that are down versus unreachable.

Server & Host Monitoring

  • Processor Load Monitor CPU usage and load averages
  • Disk Usage Track disk space, I/O performance, and mount points
  • Memory Monitoring Monitor RAM usage, swap, and memory leaks
  • Process Monitoring Ensure critical processes are running
  • Linux/Unix Servers Native monitoring for all Unix-based systems
  • Windows Servers Full Windows monitoring via NSClient++ or NRPE
  • Resource Utilization Complete visibility into system resources
Monitor host resources including processor load, disk usage, system logs, and more on Linux, Unix, and Windows systems.

Application & Service Monitoring

  • Database Servers Monitor SQL Server, Oracle, MySQL, PostgreSQL, MongoDB
  • Web Servers Apache, Nginx, IIS, Tomcat monitoring
  • Mail Servers SMTP, POP3, IMAP service checks
  • Directory Services LDAP, Active Directory monitoring
  • Application Servers JBoss, WebLogic, Citrix, and more
  • Custom Application Simple plugin design for custom service checks
  • API Monitoring REST API and web service health checks
The simple plugin design allows users to easily develop their own service checks for any custom application.

Alerting & Notifications

  • Contact Notifications Alert when problems occur and when resolved
  • Multiple Methods Email, pager, SMS, or user-defined notification methods
  • Escalation Paths Route alerts to different teams based on severity
  • Time-Based Alerting Schedule notifications based on time of day
  • Notification Dependencies Prevent alert storms with smart dependencies
  • Flap Detection Identify services with intermittent issues
  • Custom Alert Scripts Run any notification method you can script
Get notified immediately when critical infrastructure fails, with flexible notification methods and intelligent escalation.

Event Handlers & Automation

  • Event Handlers Define actions to run during service/host events
  • Proactive Resolution Automatically fix problems before they escalate
  • Service Recovery Auto-restart failed services
  • Parallelized Checks Execute service checks in parallel for efficiency
  • Scheduled Operations Plan maintenance windows and upgrades
  • Automatic Log Rotation Built-in log file management
  • Redundant Monitoring Support for implementing backup monitoring hosts
Event handlers enable proactive problem resolution—fix issues automatically before they impact users.

Plugins & Extensibility

  • Simple Plugin Design Easy-to-use API for custom checks
  • Standard Plugins 50+ official plugins included
  • Community Plugins Thousands of plugins from active community
  • Any Language Write plugins in Bash, Python, Perl, C, PHP, etc.
  • Check Commands Flexible command definitions
  • Remote Execution NRPE, SSH, or custom methods
If you can check it with a script, you can monitor it with Nagios. The plugin architecture is powerful and extensible.

Reporting & Web Interface

  • Web Interface View current network status and performance
  • Notification History Complete record of all alerts
  • Problem History Track issues over time
  • Log File Access Review detailed monitoring logs
  • Availability Reports Uptime and SLA tracking
  • Performance Data Export metrics for graphing
  • Status CGI Functional web interface included
Optional web interface provides current status, notification history, and problem tracking. For advanced dashboards, consider Nagios XI.

Integration & Data Access

  • Status Files Real-time status data in accessible format
  • External Commands Programmatic control via command pipe
  • Performance Data Export to Grafana, InfluxDB, Prometheus
  • Event Broker Module interface for extensions
  • NDOUtils Database export for reporting
  • API Integration Integrate with ticketing, CMDB, automation
  • Third-Party Tools Works with PagerDuty, Slack, ServiceNow
Nagios integrates with your existing tools through multiple APIs, data exports, and event broker modules.

HOW NAGIOS CORE WORKS

Simple, Proven Server-Agent Architecture

Nagios uses a server-agent architecture where the Nagios server is installed on a host, and plugins are installed on remote hosts/servers to be monitored.

Process scheduler sends signals to run plugins on local/remote hosts. The scheduler manages when checks are executed based on configured intervals and dependencies.

Plugins run checks and collect data (CPU, memory, disk, services). Each plugin is a standalone script that performs specific monitoring tasks and returns status information.

Plugins send collected data back to the scheduler. This includes status codes (OK, WARNING, CRITICAL, UNKNOWN), performance metrics, and descriptive output.

Scheduler processes results, triggers alerts, updates GUI. The engine evaluates state changes, applies notification rules, executes event handlers, and updates the web interface.

Admins receive alerts and GUI displays current status. Notifications are sent via configured methods (email, SMS, custom scripts) and the web interface reflects real-time system state.

20+ YEARS OF UPTIME

Why Choose Nagios Core for Your Monitoring Needs

Continuous monitoring, instant alerts, and broad platform support help you eliminate manual checks, reduce maintenance costs, and stay ahead of critical issues.

Eliminates Periodic Testing

Continuous real-time monitoring replaces manual periodic checks, catching issues instantly.

Detects Split-Second Failures

Catches intermittent problems before they become critical incidents affecting users.

Reduces Maintenance Costs

Lower costs without sacrificing performance through automation and early detection.

Timely Management Notifications

Keep management informed with immediate alerts on control issues and breakdowns.

Cross-Platform Support

Runs on any operating system—Linux, Unix, Windows, and more.

Active Community

Excellent support from an active community with 1M+ users worldwide.

Extensive Database Support

Monitor SQL Server, Oracle, MySQL, PostgreSQL, and other database servers.

Active Development

Continuous improvements and updates from dedicated development team.

Ready to Start Monitoring?

Join thousands of organizations who trust Nagios for their infrastructure monitoring.